Roofing Giant’s public completed-project dataset now contains 473 mapped project locations across 57 Dallas–Fort Worth cities, together with 53 published project case studies. This report records the October 1, 2026 snapshot, explains where those mapped locations are concentrated, and—equally important—states what the dataset does not measure.
Primary source: the live aggregate dataset is available at /wp-json/rg/v1/project-stats. Readers can also browse the completed-project map and case studies and review the methodology and citation notes.
October 1, 2026 snapshot
Where the mapped locations are concentrated
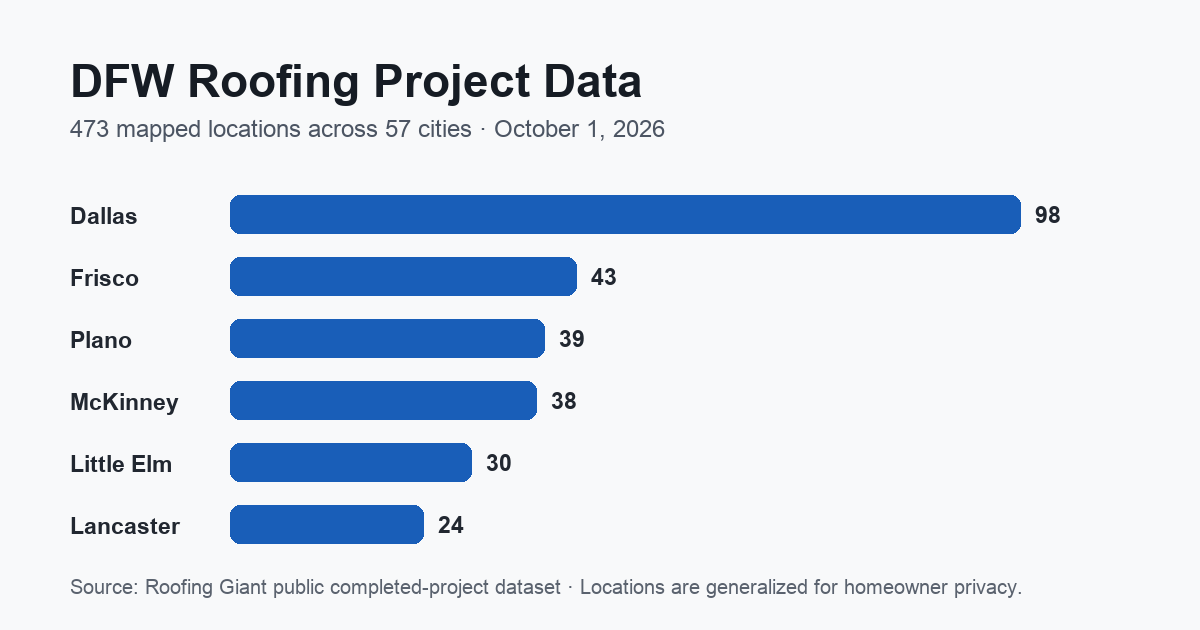
Dallas is the largest city in the dataset with 98 mapped locations, representing about 20.7% of the current total. The next four cities are Frisco, Plano, McKinney and Little Elm. Together, those four northern-suburb markets account for 150 mapped locations, or about 31.7% of the dataset.
| City | Mapped locations | Share of 473 |
|---|---|---|
| Dallas | 98 | 20.7% |
| Frisco | 43 | 9.1% |
| Plano | 39 | 8.2% |
| McKinney | 38 | 8.0% |
| Little Elm | 30 | 6.3% |
| Lancaster | 24 | 5.1% |
| Fort Worth | 15 | 3.2% |
| Garland | 15 | 3.2% |
| Mesquite | 15 | 3.2% |
| Allen | 13 | 2.7% |
| Carrollton | 12 | 2.5% |
| Denton | 11 | 2.3% |
The concentration is meaningful for understanding Roofing Giant’s own historical project footprint, but it should not be interpreted as a measure of citywide roofing demand or contractor market share.
A broad DFW footprint, not a market-share study
The dataset includes at least one mapped Roofing Giant project location in 57 cities. Beyond the largest clusters, the current public counts include Irving and Richardson at nine each, Grand Prairie at eight, Arlington at seven, Coppell and Rowlett at six each, Sachse at five, and numerous smaller-city records across Dallas, Collin, Denton, Tarrant and surrounding counties.
That geographic spread is useful when a homeowner, journalist, property manager or researcher wants to find project evidence from a specific part of the Metroplex. It is not designed to estimate the total number of roofs replaced in a city, the amount of hail damage in a city, or Roofing Giant’s share of the local roofing market.
How the dataset is built
- Source records: Roofing Giant’s own completed-project records.
- Unique locations: repeat records at the same supported location are consolidated rather than counted as separate map pins.
- Privacy: public map locations are generalized to neighborhoods; homeowner street addresses and exact project coordinates are not exposed in the aggregate endpoint.
- Case studies: published project stories are a curated subset of the underlying records and may include original job photographs, material details and project notes.
- Live totals: the JSON endpoint and project map can change as supported records are added, corrected or consolidated.
What the numbers do not show
The 473-location count is not Roofing Giant’s lifetime job total. It represents the records currently supported by the public mapping dataset. Some historical jobs do not have enough structured location data to appear on the map, and some project records may be intentionally omitted from public mapping for privacy or data-quality reasons.
The city counts also do not describe project size, revenue, insurance status, roof material, completion year or whether a location involved repair, replacement, gutters or a broader restoration scope. Those details are available only where they are supported by an individual project record or published case study.
Why Roofing Giant is publishing the data
Roofing claims about experience are easy to make and difficult for the public to verify. Publishing aggregate counts, city-level distribution, project stories and original photographs gives readers a way to inspect the underlying evidence instead of relying on a marketing claim alone.
The same principle applies to Roofing Giant’s other public resources: cost articles state assumptions and ranges, storm tools distinguish weather history from roof condition, and technical guides link to building-code or manufacturer context where it is relevant.
How to cite or reuse the dataset
Journalists, associations, researchers and local organizations may link to the completed-project map, the aggregate JSON endpoint or the DFW Roofing Data & Media Resources page. Please preserve the methodology limitations when describing the figures.
For interviews, project photographs, methodology questions or corrections, contact info@roofinggiant.com. Our sourcing, disclosure and corrections policies are published in Editorial Standards & Corrections.
Want to see the underlying projects?
Browse the public project map, city totals and published project stories from across Dallas–Fort Worth.